


The Item Attribute Differentials Screen gives an overview of the performance of selected attributes within each cluster. The screen is primarily used to highlight relative under and over performance of key product attributes within each cluster.
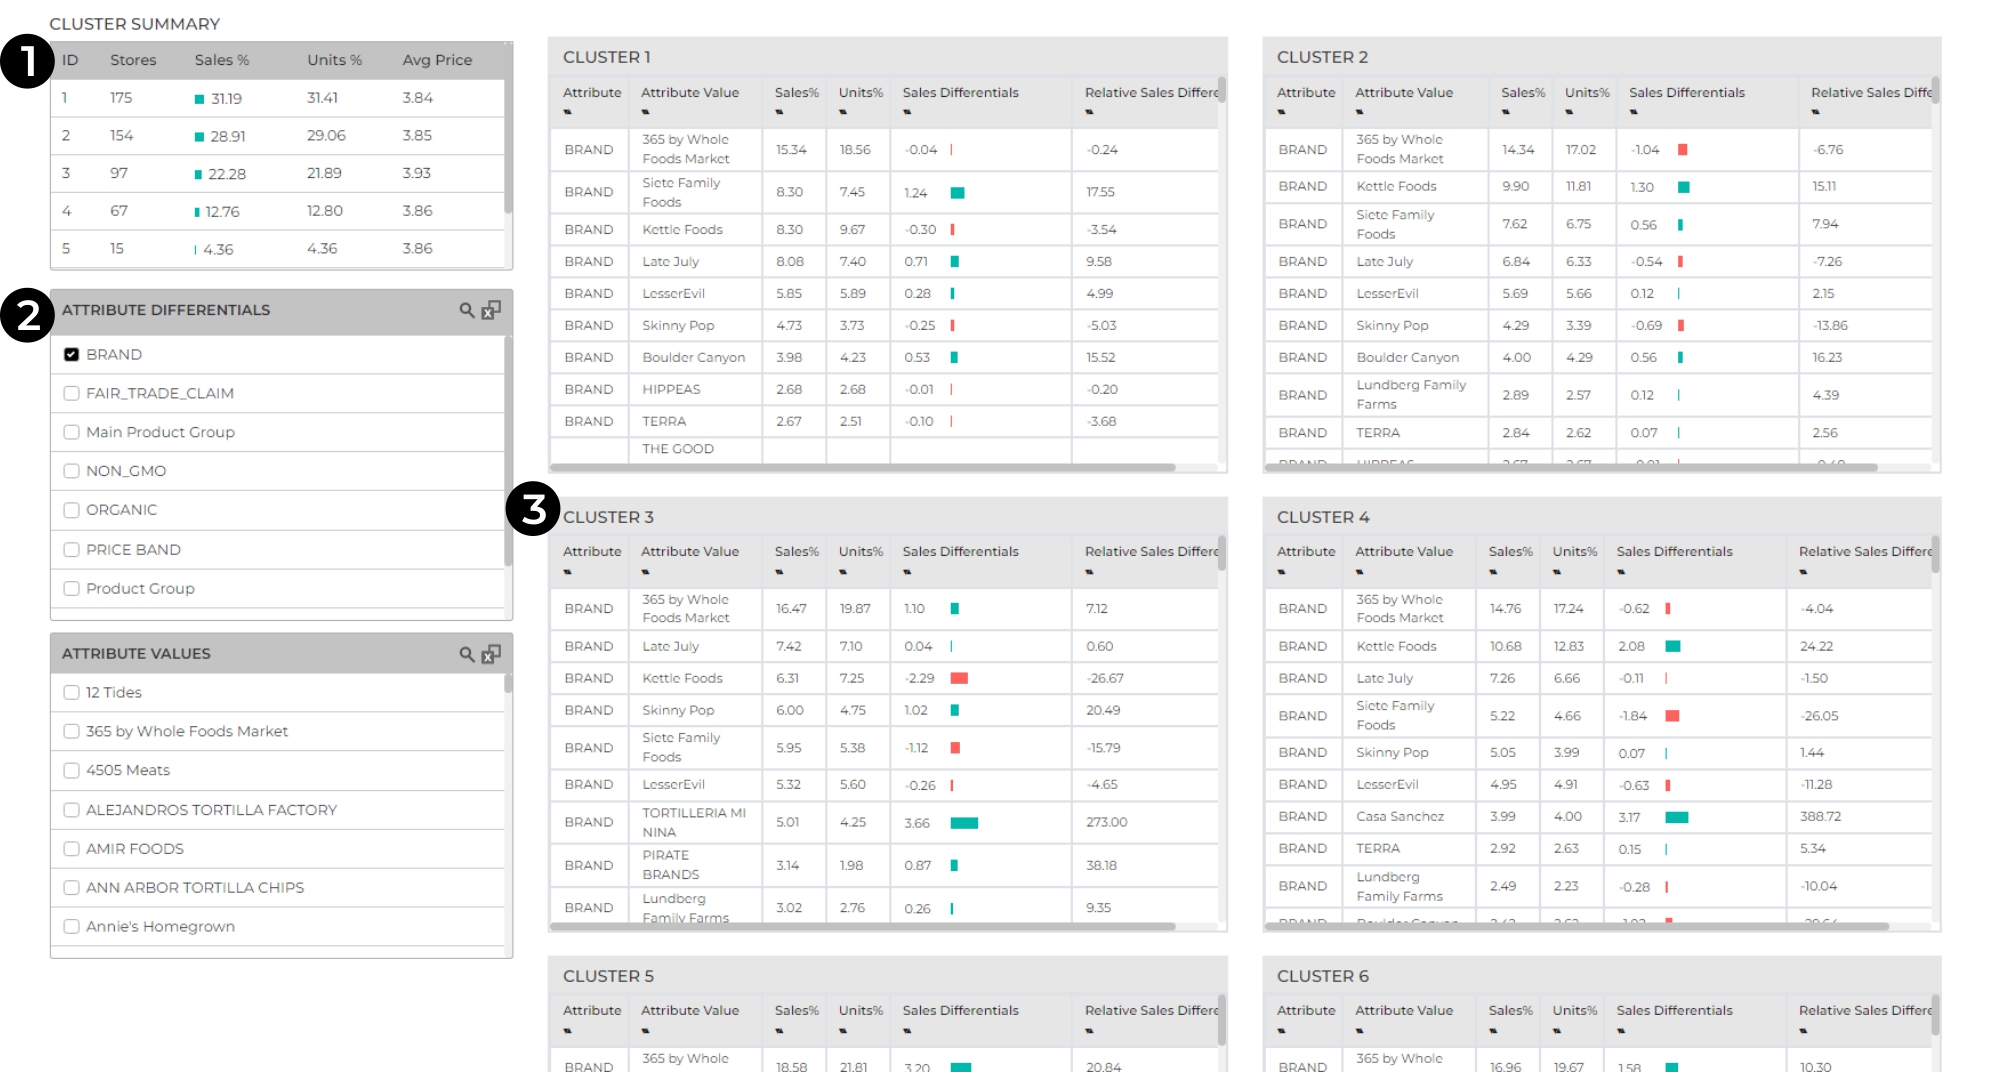
- Cluster Summary – A summary of basic cluster statistics. Clicking on a cluster filters the information on the page to reflect the selected cluster.
- Attribute Differential Filters – Allows the user to select the product attribute they would like to review.
- Cluster Differentials – Displays the sales performance as a variance from the project average.
- The data is made up of the following items:
- Attribute – Shows the product attribute the user has selected
- Attribute Value – Shows the different values of the attribute eg. brands etc
- Sales% – The % value this attribute value delivers for this cluster of stores
- Units% – The % volume this attribute delivers for this cluster of stores
- Sales Differentials – The percentage point difference between the Sales % of this cluster and the project average (all stores)
- Relative Sales Differentials – The % difference between the Sales % of this cluster and the project average (all stores)
Example
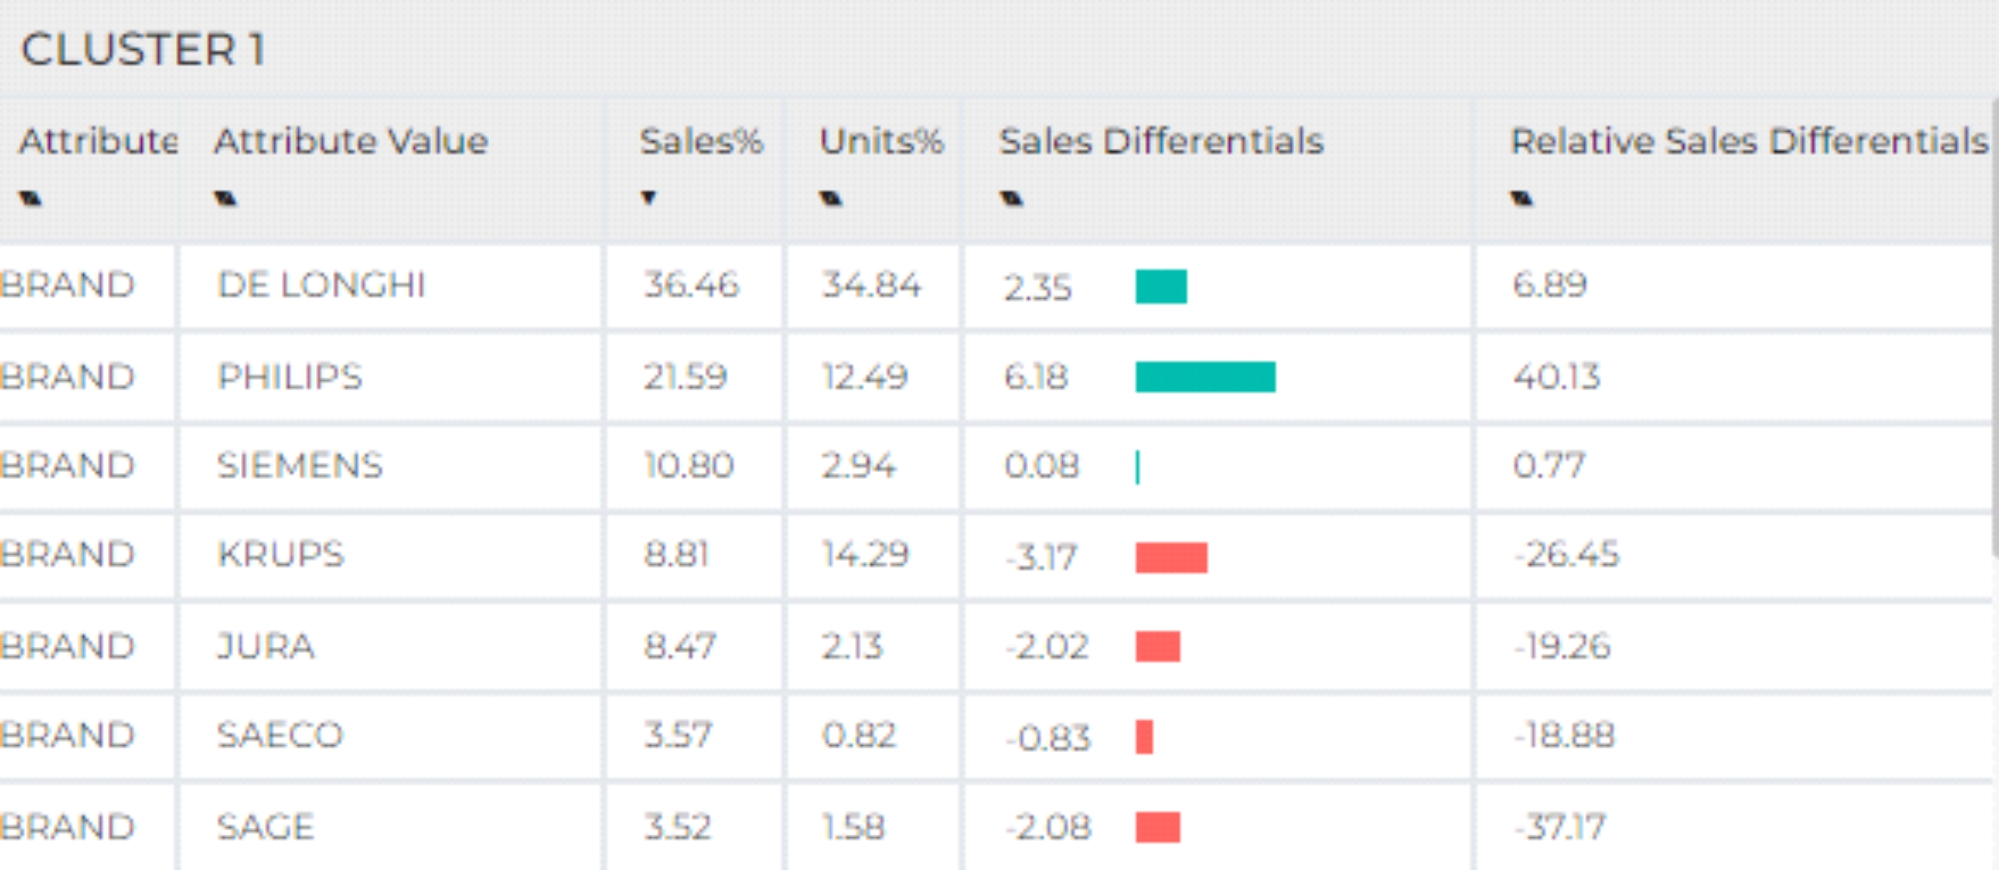
- In the above example brand performance is being presented for a group of stores in Cluster 1.
- De Longhi is the strongest performing brand in this cluster responsible for 36.46% of sales in cash and 34.46% of sales in units
- The De Longhi sales in cash for cluster 1 stores are +2.35ppt (percentage points) higher than those of the total project ie. the average of all stores is 34.11% (36.46 – 2.35) but cluster one stores overperform by +2.35 ppt
- The Relative Sales Differential for De Longhi of +6.89% is the expression of the Sales Differential PPT change as a percentage ie. +2.35ppt is equal to a % change of +6.89%
Within this screen, there is a Retailigence generated attribute called Price Band. Price band is an attribute that reflects a products cost in relation to the other products within its product group. This can lead to the cluster average price and the price band appearing to give conflicting information so there is a supporting document for an in depth look.
If this tab highlights what is different between each cluster, the next few tabs help to show what may be driving this difference.