


The Base Assortment screen is the initial screen for viewing the output that will be implemented at the end of the assortment process.
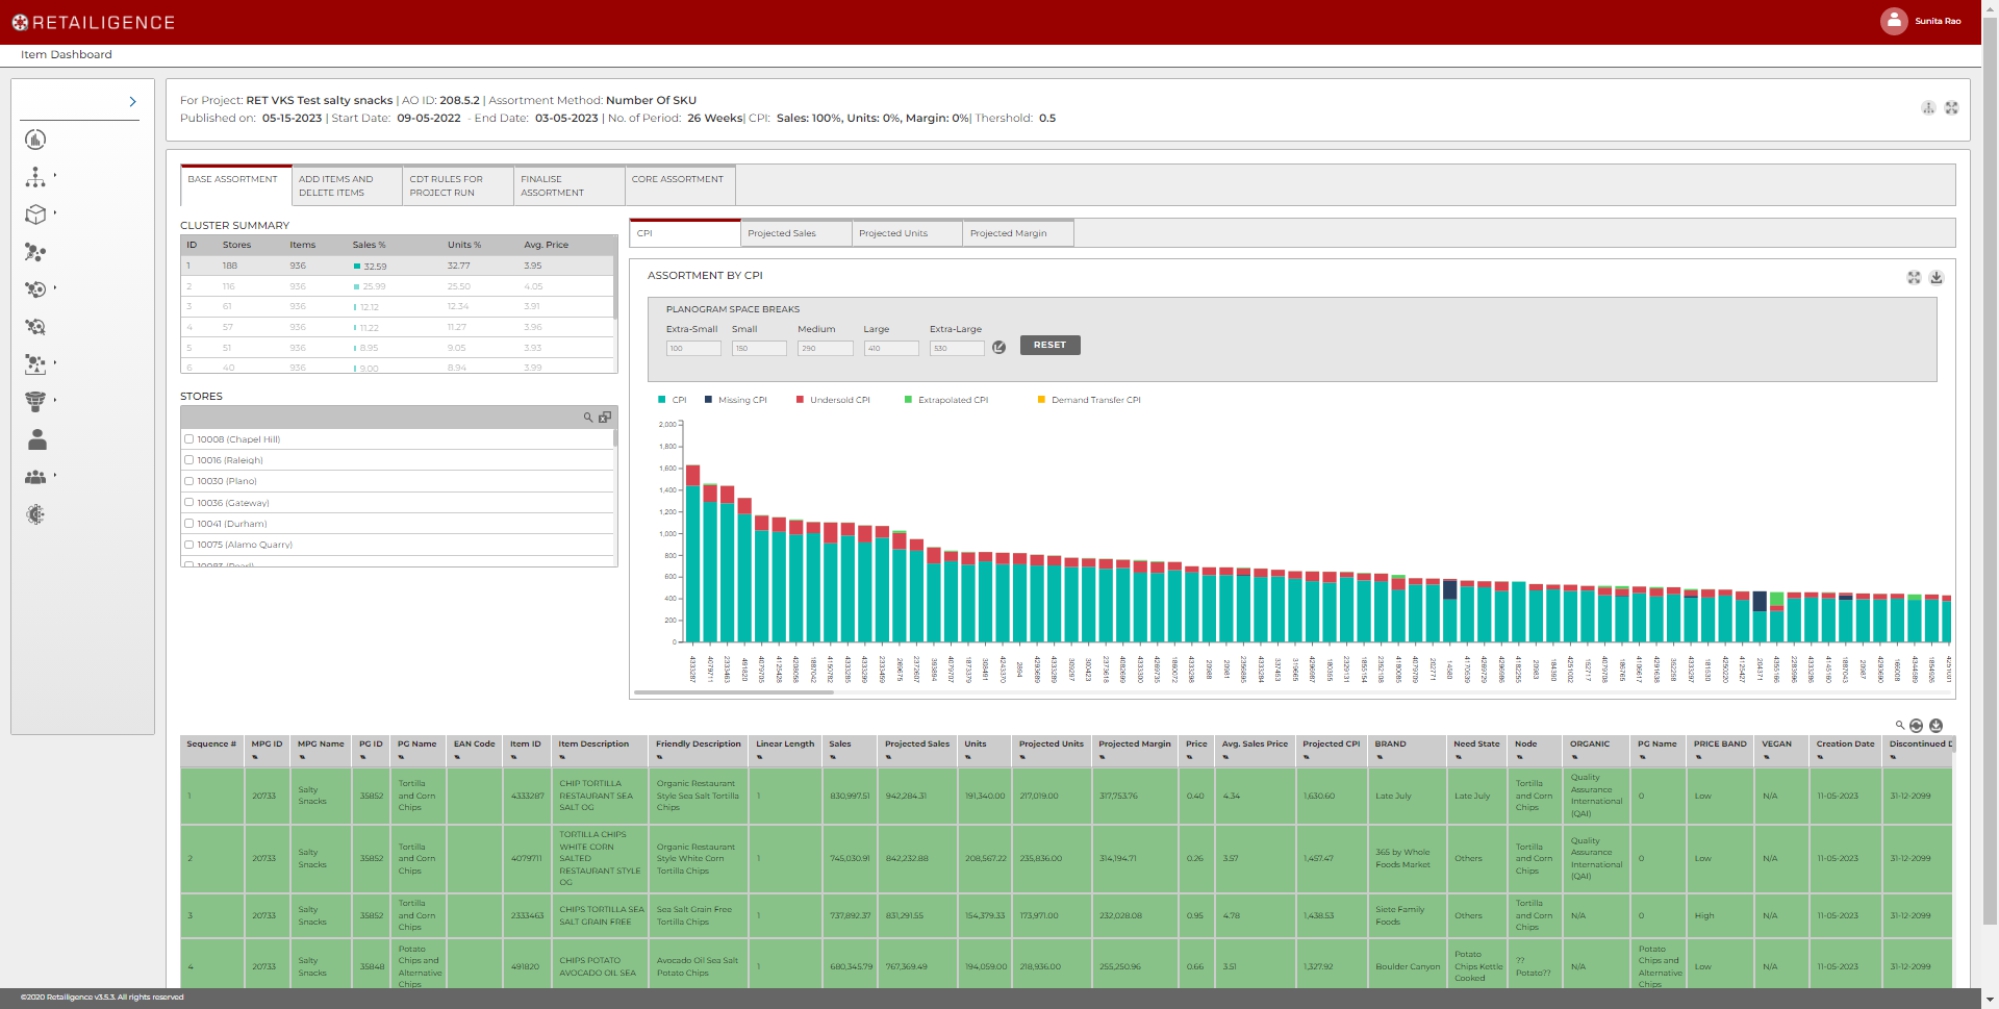
The screen allows you to view graphs of the performance of products for each cluster, with a table underneath that displays how potential ranges will fit into each of the space breaks.
When accessing this screen the user should do the following
1 – Populate the planogram space breaks if these are not prepopulated (Fig 1 number 5)
2 – Click on a Cluster (Fig 1 number 2) and see if the assortment looks credible.
Space Assortment by Sales is for viewing the output that will be implemented at the end of the assortment process. The screen allows you to view graphs of the performance of products for each cluster, with a table underneath that displays how potential ranges will fit into each of the space breaks.
When accessing this screen the user should do the following
- Populate the planogram space breaks (Fig 1 number 5)
- Click on a Cluster (Fig 1 number 2) and see if the assortment looks credible.
- Later the user will return to this screen for making final adjustments in the table (Fig 3).
Fig 1. Space Assortment by Sales Screen1. Dashboard Tabs – Tabs to navigate between each page of the dashboard.
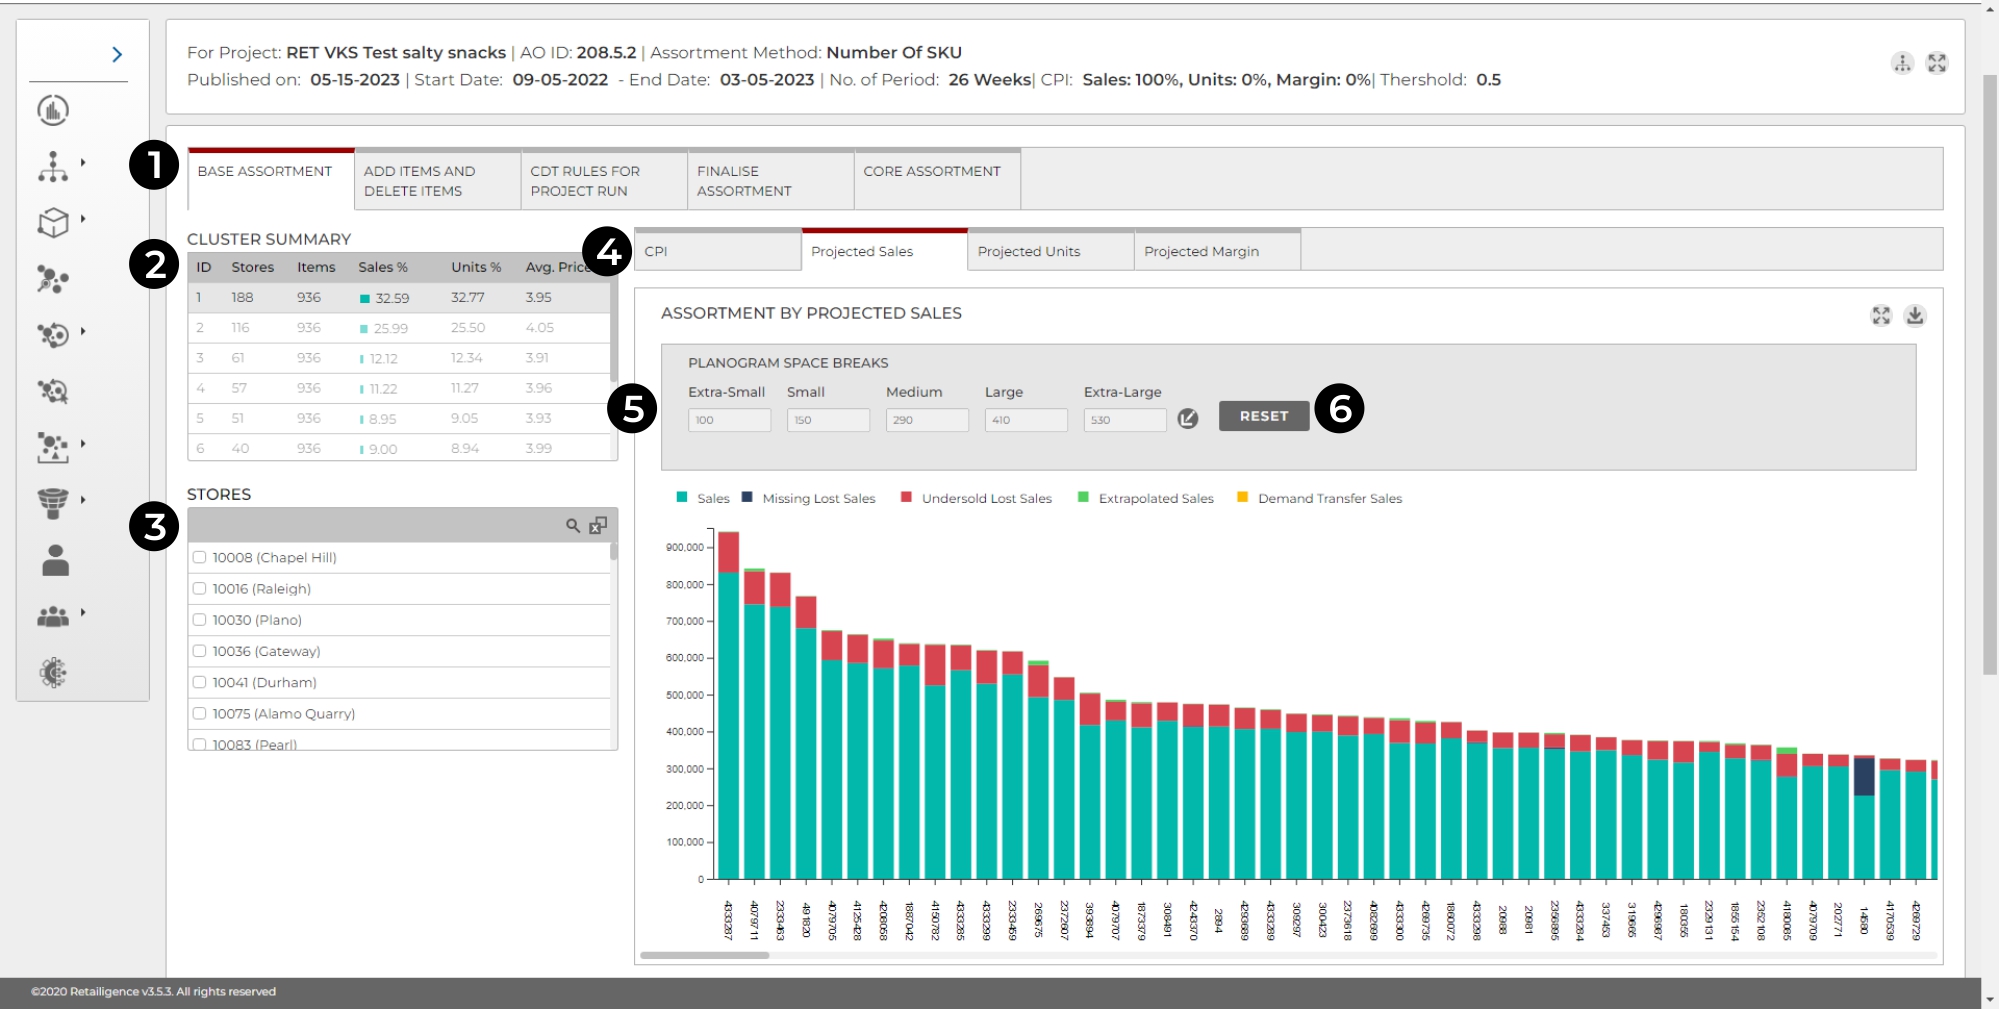
- Tab Selection – Allows the user to navigate between the various tabs within the dashboard.
- Cluster Summary – Shows the number of stores in each cluster alongside a few other top line statistics. Clicking on one of the clusters will change the whole page to provide specific information regarding the selected cluster. This function allows us to investigate and manipulate the output for each cluster.
- Store List – Displays a list of stores within the selected cluster or all stores if no cluster is selected. Selecting a store from this list will provide specific information regarding the selected store. Stores can then be deselected using the same process.
- Graph Metric Selection – These tabs can be used to view the graphed data by CPI projected sales, projected units or projected margin.
- Assortment Graph – Displays a graph of product performance, also showing space breaks (When applied) and any performance figures adjusted by the Retailigence algorithms. The graph can be switched between various metrics using the tabs above the graph.
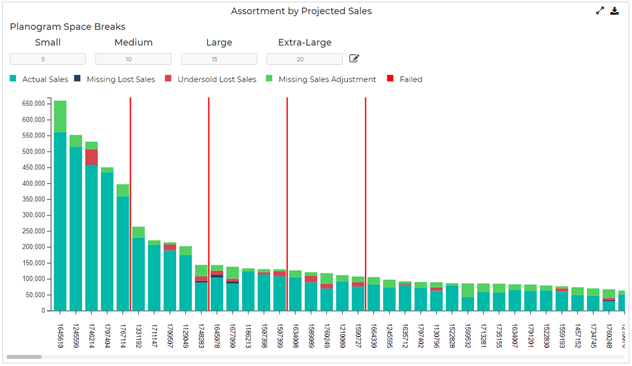
- Space Break Input – Clicking the Icon Allows the user to input numbers for the space breaks. The number inputted for a space break will insert a red cut off line on the graph, showing the number of products that fit in the chosen space break. (The inputted number should be the chosen number of products) The Icon used to edit will turn into a save icon when the fields are being edited. The user needs to click this to save changes. The Check status button will appear and will need to be refreshed as explained earlier.
Fig 2. The Assortment Graph with Space Breaks for a Selected Cluster
When a specific cluster is selected (Fig 1. Point 2), the Assortment Data Table will appear under the assortment graph, displaying the products for the cluster in order of importance.
The Assortment Data Table appears when a cluster is selected and displays the selected cluster assortment data as a table, using different shades of green to indicate the space breaks. The top right of the table features icons to search, reset data and download data.
Fig 3. Assortment Data Table
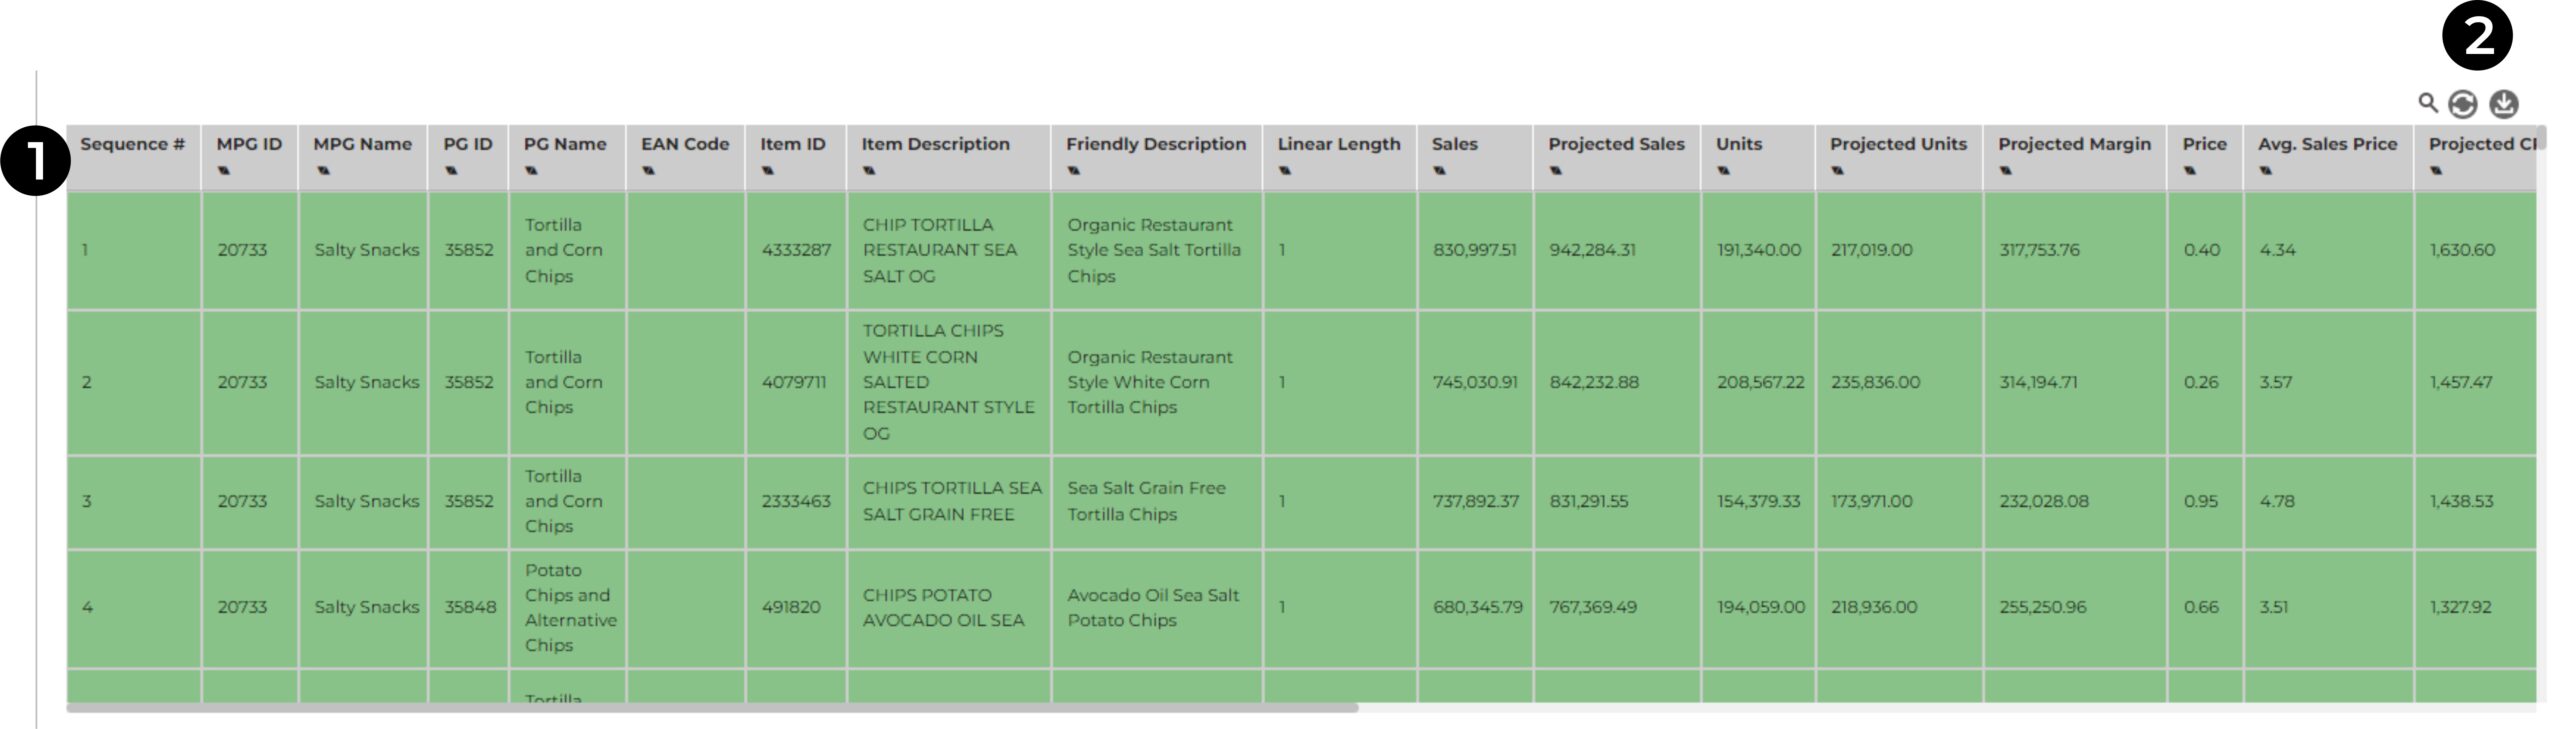
- Sequence Number – The sequence number is the order of the products in the base assortment.
- Search/Reset Data/Download – The search button allows the user to search the entire table for a number/text. Upon typing the search and pressing enter, the matches are filtered out. The reset data button undoes any searches. The download button allows the user to download the table out of the tool onto their desktop.