The lowest level of detail is available in the planogram view and enables category managers/ space planners to make more detailed analysis on individual categories.
It is accessed from the purple icon on the dashboard.

- The desired planogram is selected using the drop down box.
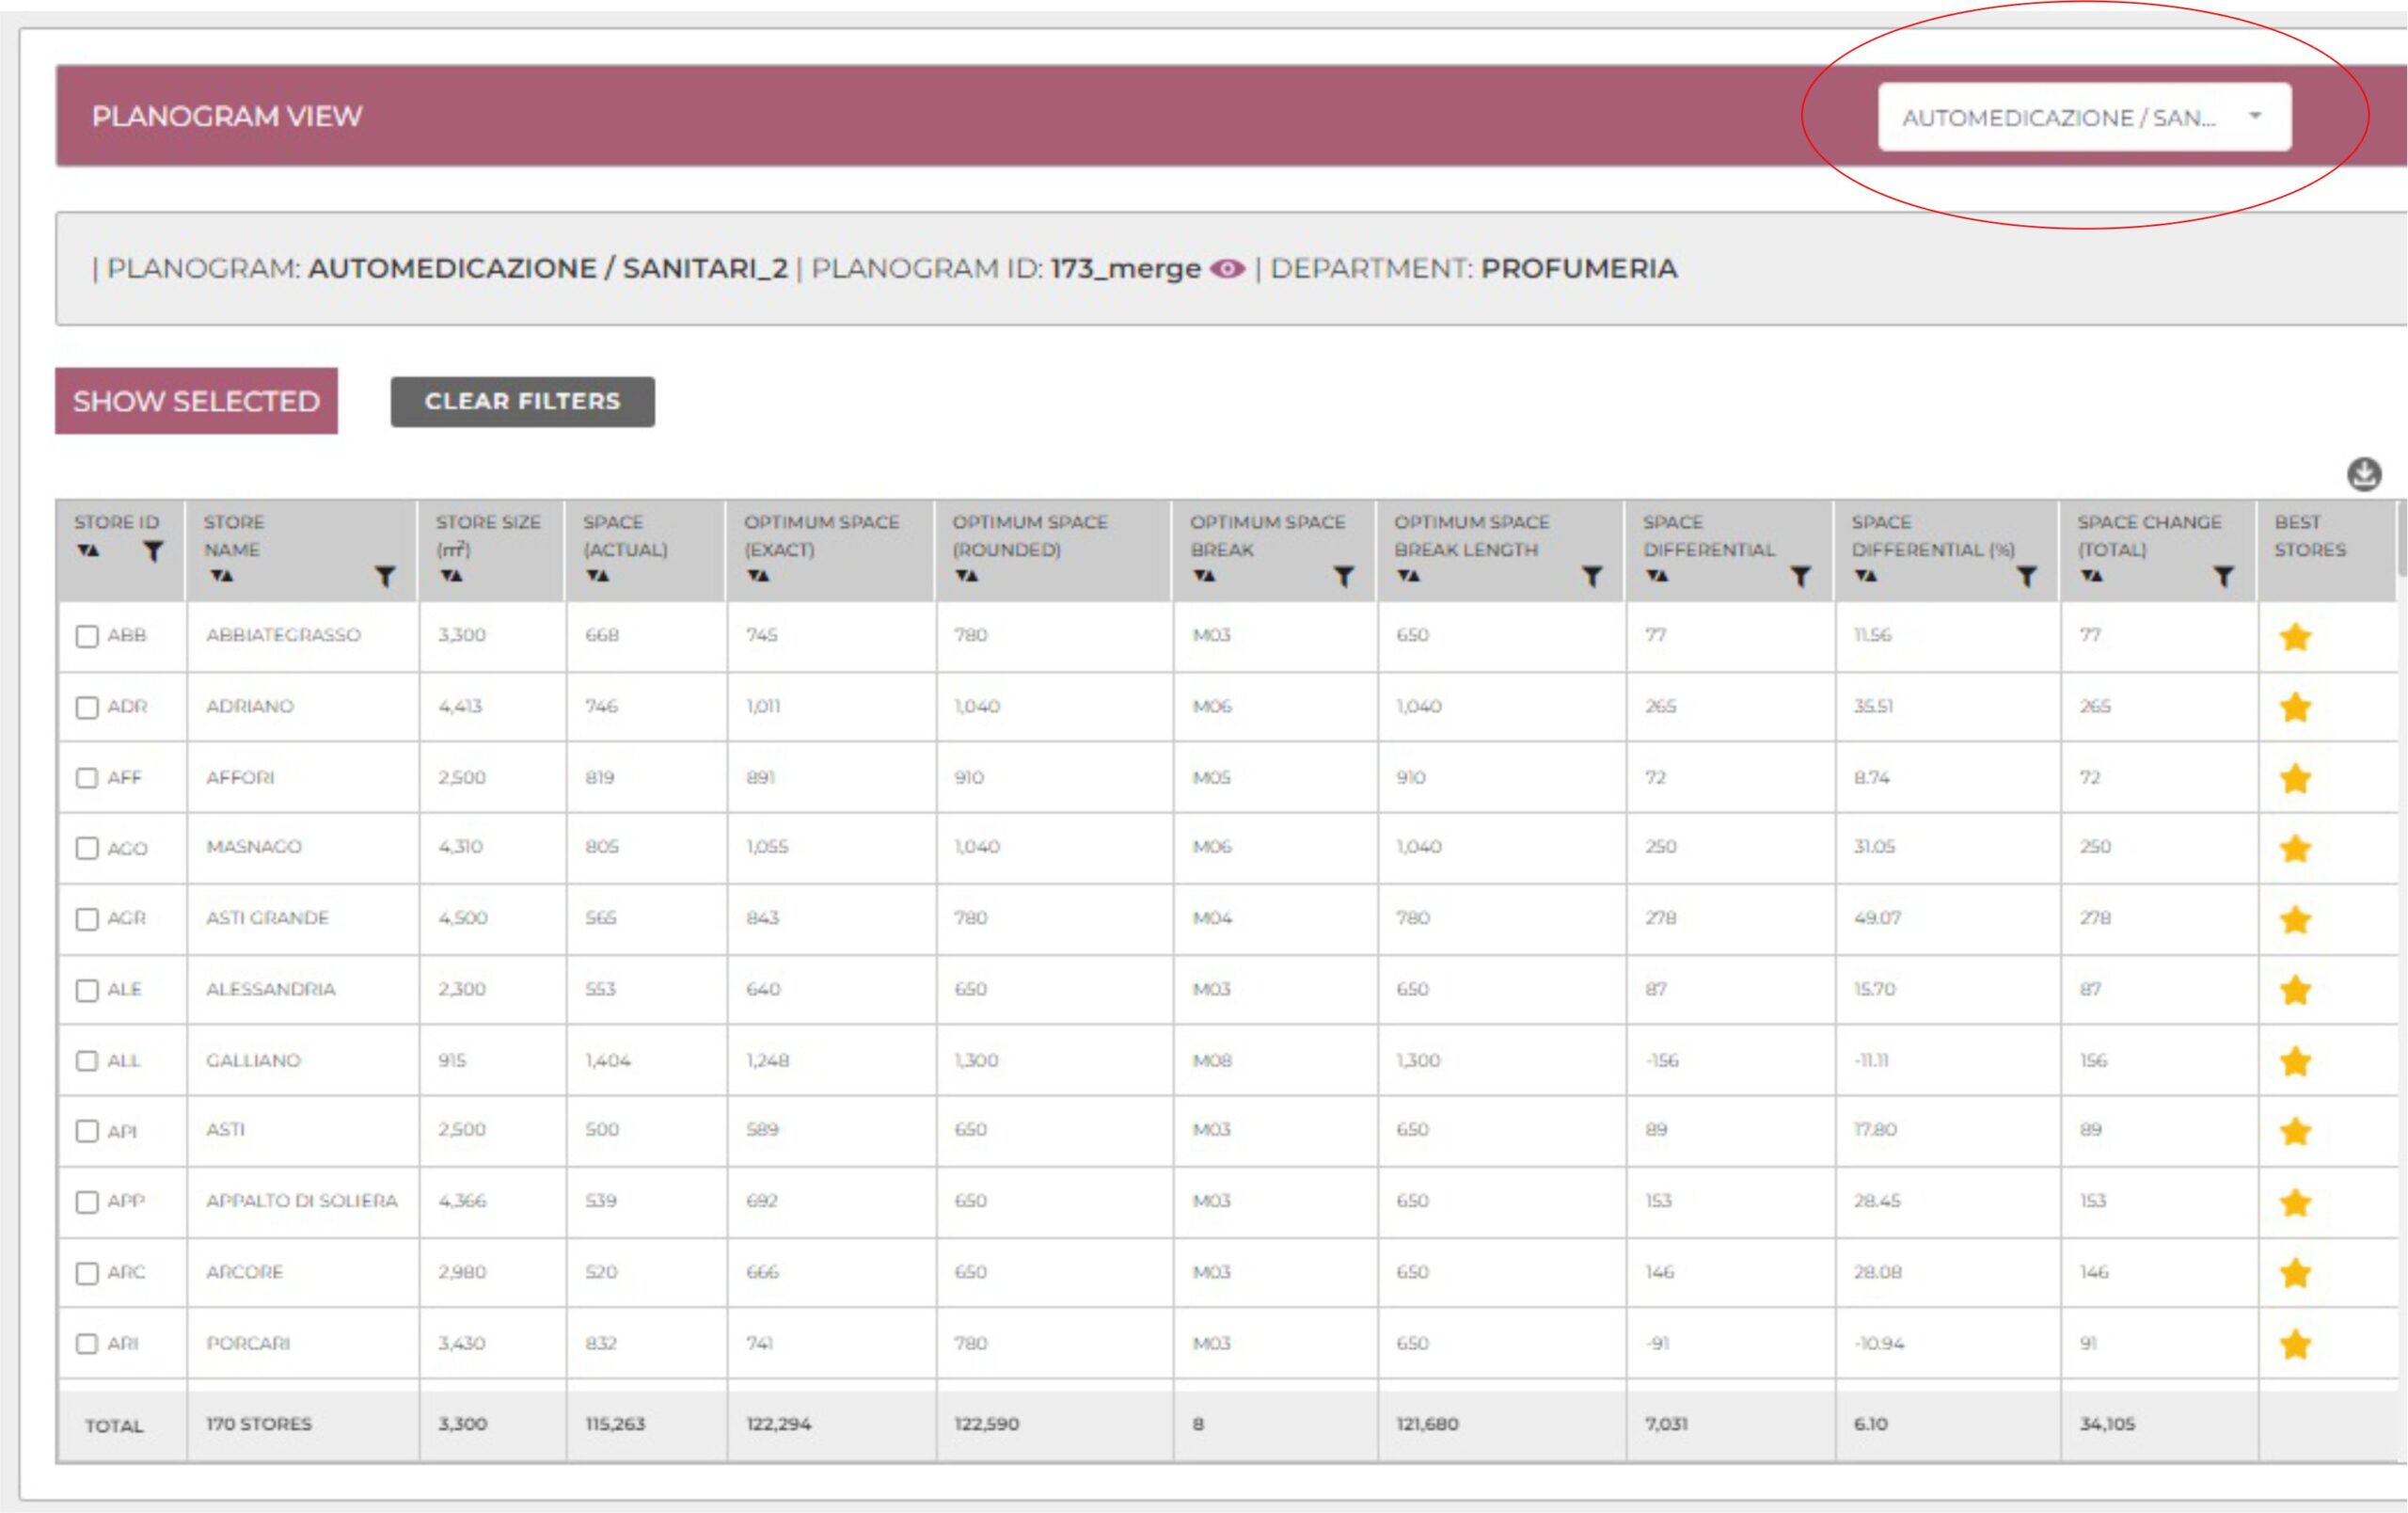
- The table on this screen shows full details of the selected planogram for each store with a summary at the bottom
- The columns may be sorted and filtered as the user desires enabling straightfoward analysis within the screen itself.
For example, the user may use the filter on space differential % to view all stores where the recommended space increase is greater than 30%. Selecting such filters also causes the the summary at the bottom of the table to be automatically updated.
- The download icon
 , enables the user to continue more complex analysis in spreadsheet format
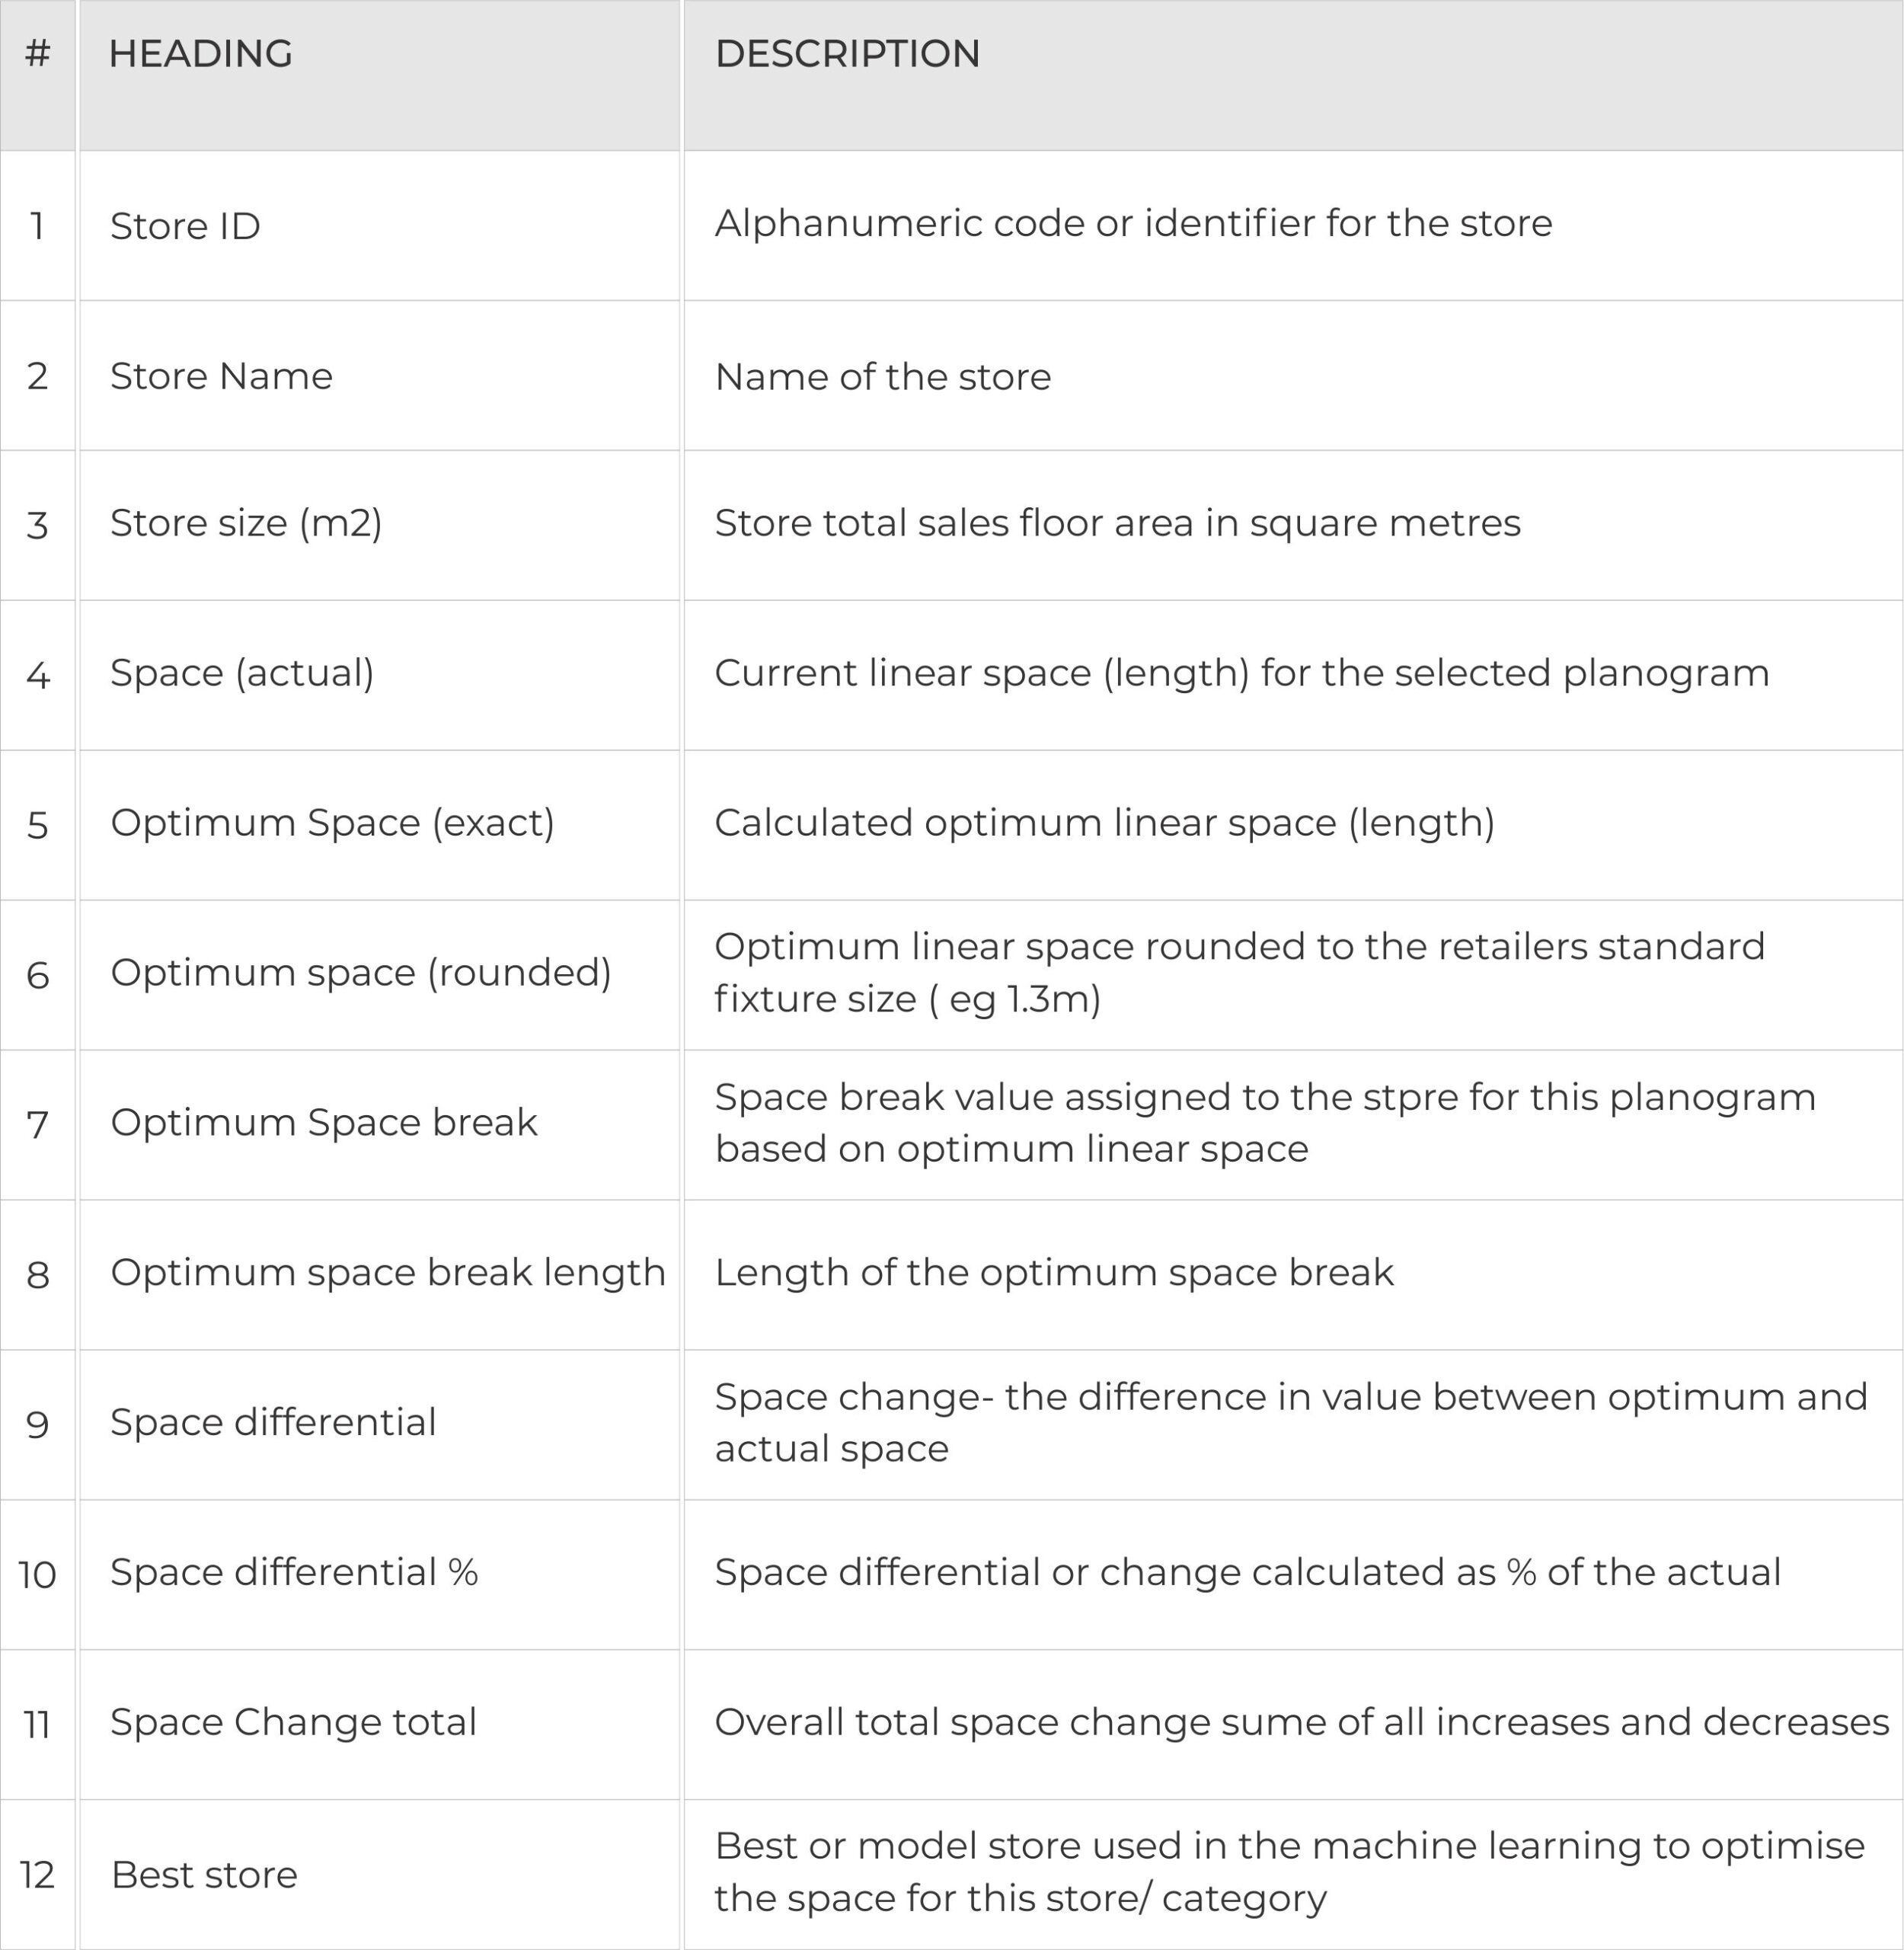
Description of the columns